UI/UX and Graphic DesigN
I worked on a multitude of different projects for the Genentech Research and Early Development IT department. The main project was a redesign of the departments intranet site. The site is used for those within the IT department, as well as business partners and scientist across Genentech/Roche to access and learn about the different applications they support. Unfortunately much of the information on the site is proprietary and the content can not be displayed on the web.
Because of the success with the intranet site. The gRED IT department extended my contract to help assist in other needed design projects, including logo designs, banners and posters, process maps and more.
gRED IT logo design
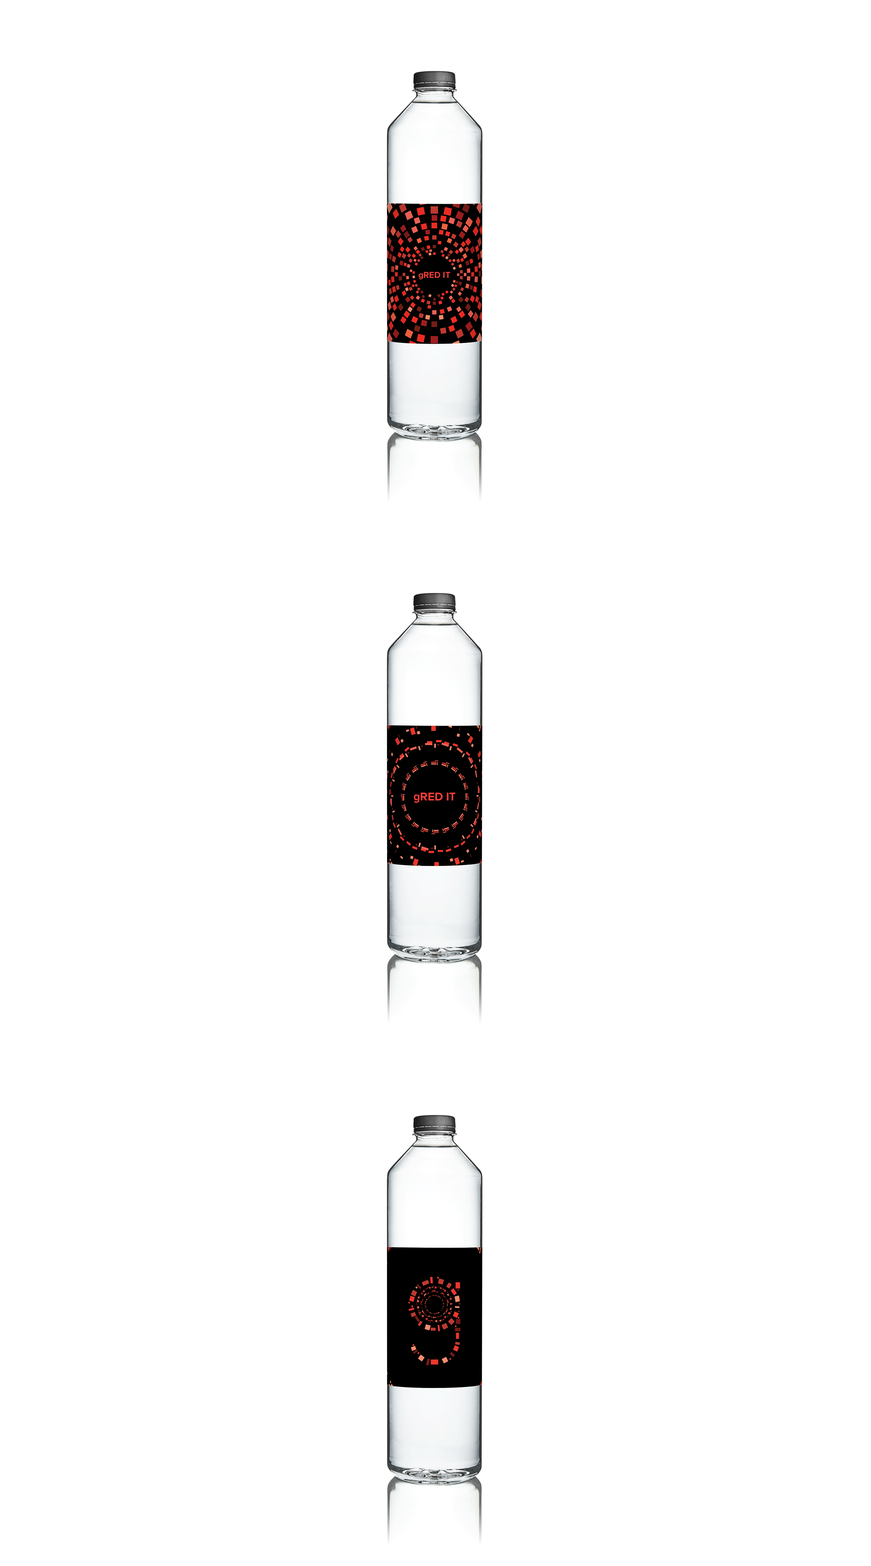
The Genentech Research and Early Development IT department was looking for a new and improved branding assets for promotional use within the compnay. The goal for this project was to create a more visually appealing design that creatively incorporated the the letter “G”, or the acronym for the department “gRED IT”.
For this proposal I wanted to utilize our biotechnology background with the a red color palette. After some research and brainstorming I decided I was going to create something that drew upon electrophoresis. The process of separating DNA fragments and other macromolecules by size and charge and displayed in a visual way. Using this as the starting point for the design I came up with multiple different iterations of rounded representations of DNA electrophoresis.
The overall outcome was a success and the department was very pleased with all the designs. After reviewing each one they decided to keep all of them to use for stickers, water bottles, t-shirts, bags and other promotional material .
SADR LOGO DESIGN
A subset department within gRED IT asked me to assist in their logo design for a new application they were rolling out called SADR. This application helps scientist visually represent safety assessment data.
The proposal for the logo was very open ended. The only ask was to incorporate the acronym SADR. With this I came up with multiple different iterations using the idea of a DNA helix and data visualization. The finalized logo is pictured above.
Process Maps
The gRED IT department is constantly going through a reorganization and asked me to create visual representations of specific processes they work with. Above are samples of a few visual process maps I created, unfortunately the informations on the maps are proprietary and cannot be shared on the web.


